Check out the awesome demos
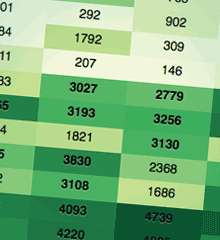
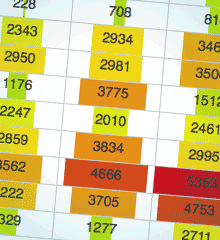
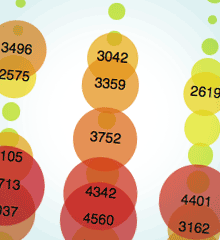
GraphUp is flexible jQuery plugin that allows you to spice up your plain data tables in a snap. Table data is visualized using colors, bar charts or bubbles right in the table itself.
Installation
Step 1 · Load the script
For starters, you include the required javascript files in the <head> of your HTML document.
<script src="https://ajax.googleapis.com/ajax/libs/jquery/2.2.2/jquery.min.js"></script>
<script src="path/to/your/jquery.graphup.min.js"></script>
Note that in the snippet above, I am loading a Google hosted jQuery copy. You can host it yourself too.
Then, you load the GraphUp Plugin. Remember to change the src path to match the location of the file on your server.
Step 2 · Showtime!
All that is left to do, is to connect your table cells (not the whole table) with the GraphUp Plugin.
Append the following piece of javascript to the <head> of your HTML file.
Alternatively, you could move it to an external file.
<script>
$(document).ready(function() {

	// Here we're "graphing up" only the cells with the "data" class
	$('#your_table td.data').graphup({
		// Define any options here
		colorMap: 'thermometer',
		painter: 'bubbles',
		bubblesDiameter: 80 // px
		// ...
	});

});
</script>
Have a look at the demos to see some real code in action. Have fun!
Options
Options listed in alphabetical order
| Option | Description |
|---|---|
barsAlign |
string · Default: 'left'This option is related to the bars painter.
Use it to set the alignment of the bar charts.
The following settings are available:
|
bubblesDiameter |
number · Default: nullThis option is related to the bubbles painter.
Use it to set the maximum diameter (in pixels) of a bubble.
By default the maximum diameter will be the double of the cell height.
|
callBeforePaint |
callback · Default: nullCallback that is fired right before a cell will be painted. At this point the cell has been cleaned and its value and percentage are stored with it. You can access those using the jQuery.data method:
this.data('value') and this.data('percent').
The whole cell element itself is available as this in your callback function.
|
classBar |
string · Default: 'bar'The CSS class that will be used for each bar. |
classBubble |
string · Default: 'bubble'The CSS class that will be used for each bubble. |
cleaner |
string or function · Default: 'basic'A cleaner is a function that will look at the contents of cell and turn it into a clean number. The following cleaners are available out of the box:
|
colorMap |
string or array · Default: 'heatmap'Many painters will use a color map to colorize their graphs.
A color map basically defines a gradient (going from 0% to 100%) from which a color will be picked according to a cell's percentage.
The following color maps are available out of the box:
E.g.: [[255,255,255], [0,0,0]] (white to black).You can predefine your own color maps too. |
decimalPoint |
string · Default: '.'The separator for the decimal point, either . (period) or , (comma).
|
defaultValue |
number · Default: nullIt may happen that some cell values can't be cleaned properly. By default those cells will be ignored and won't be painted. However, if you provide a default value for those cells, they will be treated normally. |
max |
number · Default: nullIn order to calculate a percentage we need to know the highest value. By default this will be the highest value GraphUp can find in the provided cells. However, the highest value might not be present in any cell. This option allows you to set it manually. |
min |
number · Default: nullIn order to calculate a percentage we need to know the lowest value. By default this will be the lowest value GraphUp can find in the provided cells. However, the lowest value might not be present in any cell. This option allows you to set it manually. |
painter |
string or function · Default: 'fill'This function makes the magic happen. It visualizes the cell's value. The following painters are available out of the box:
|
Global defaults
You can easily change the default values for the options listed above. Just include the following javascript. This only needs to be called once. Of course, you can set all options to whatever you like.
$.fn.graphup.defaults = {
	cleaner: 'strip',
	painter: 'bars'
	// Etcetera
}
Custom cleaners
You can create a custom cleaner by defining a new method for the $.fn.graphup.cleaners object.
Then simply set the cleaner option to the name of your method.
$.fn.graphup.cleaners.myCleaner = function(value, options) {
	// The value argument contains the uncleaned cell value.
	// The options argument contains the options object.
	// The function should simply return the cleaned value.
	return parseFloat(value);
}
Custom painters
You can create a custom painter by defining a new method for the $.fn.graphup.painters object.
Then simply set the painter option to the name of your method.
$.fn.graphup.painters.myPainter = function($cell, options) {
	// The $cell argument contains the cell as jQuery object.
	// The options argument contains the options object.
	// Demo: we're replacing the cell's content with its percentage value.
	$cell.text($cell.data('percent') + '%');
}
Have a look at the unpacked source code of the plugin for more examples. The code is well documented.
Custom predefined colorMaps
You can provide an array with a custom color map to the colorMap option.
However, if you end up using the same color scheme again, it is a good idea to predefine your own colorMap.
$.fn.graphup.colorMaps.myColorMap = [[255,255,255], [0,0,0]];